Visual Exploration of Large-Scale Image Datasets for Machine Learning with Treemaps
Bertucci, D., Hamid, M. M., Anand, Y., Ruangrotsakun, A., Tabatabai, D., Perez, M., & Kahng, M.
IEEE Transactions on Visualization and Computer Graphics, 29(1), 320–330 (Proc. IEEE VIS 2022) · 2022
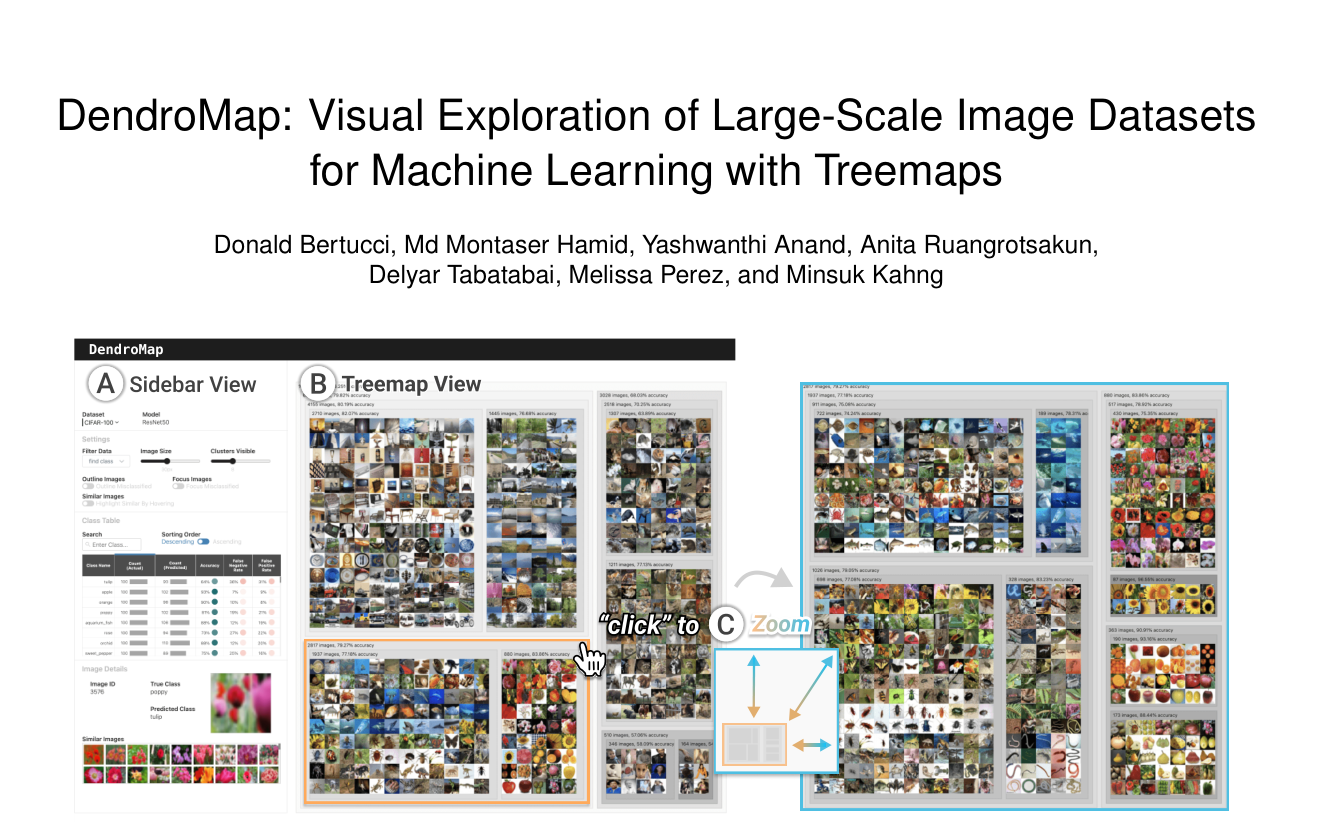
DendroMap is an interactive visualization for exploring large-scale image datasets in machine learning. It adapts treemaps to reveal the hierarchical cluster structure of image datasets, letting ML practitioners overview a dataset's distribution and zoom into image groups at multiple levels of abstraction. In a 20-participant user study against a grid-based t-SNE baseline, participants preferred DendroMap.
My role: I worked on this project as a member of the Data Interaction and Visualization Lab at Oregon State University (advisor: Minsuk Kahng), within the DARPA Explainable AI (XAI) program, contributing to the design and development of the tool and its use for analyzing and debugging errors of image classification and object detection models.
The problem
ML practitioners often explore image datasets with image grids or t-SNE/UMAP projections, but these approaches do not effectively scale to large datasets: images are poorly organized, overlap each other, and offer limited interaction. Unlike tabular data, images are unstructured — common operations like filtering, grouping, and sorting cannot be easily applied.
What we did
DendroMap extracts a hierarchical clustering of images from their high-dimensional representations (e.g., a ResNet50's embeddings) and renders it with a modified treemap. Users see the overall distribution at a glance, click to zoom into clusters of interest, and inspect per-cluster statistics such as image counts and classification accuracy. A sidebar provides a class table with accuracy, false-negative and false-positive rates, and details for individual images — including model predictions and similar images.
Key results
- Case studies with widely-used deep learning image datasets showed how DendroMap surfaces insights about dataset diversity, underperforming subgroups, and classification errors.
- In a within-subject user study, 20 participants performed seven grouping and searching tasks with both DendroMap and a gridified t-SNE baseline; DendroMap received higher post-questionnaire ratings on 8 of 10 questions, and participants preferred it.
- Participants especially valued the per-cluster information: "I like the clusters having details like how many images and the accuracy."
- DendroMap is open-source with a live demo at div-lab.github.io/dendromap.
From the paper